


This is a collaboration post written by the Paulson Institute’s Anders Hove, Associate Director for China Research, Lauri Myllyvirta, Energy Campaigner from Greenpeace, and Calvin Quek, Head of Greenpeace East Asia’s Sustainable Finance Program.
The air quality in 2015 has taken us in Beijing by surprise. For the first five months of 2015, the average monthly PM2.5 level was 82 µg/m3, noticeably lower compared to the same period in 2013 and 2014, when concentrations averaged 102 µg/m3 and 98 µg/m3, respectively. With two years having since passed since China’s declaration of War on Pollution, many Beijingers are wondering – are we winning the war, and have we seen the end of Beijing “airpocalypses”?
So could blue skies in Beijing be the new normal? This is a difficult question to answer, for several reasons.
First, official tracking of PM2.5 data in Beijing only dates back to 2013, so long-term comparisons are difficult. This matters because a few weeks of good or bad air can skew data for a single year. For example, 2013 and 2014 both saw a few months of heavy haze, skewing annual averages significantly. Because of this, as blogged by the Paulson Institute’s Anders Hove, it is difficult to definitively call Beijing’s current relatively low pollution levels a long-term trend.
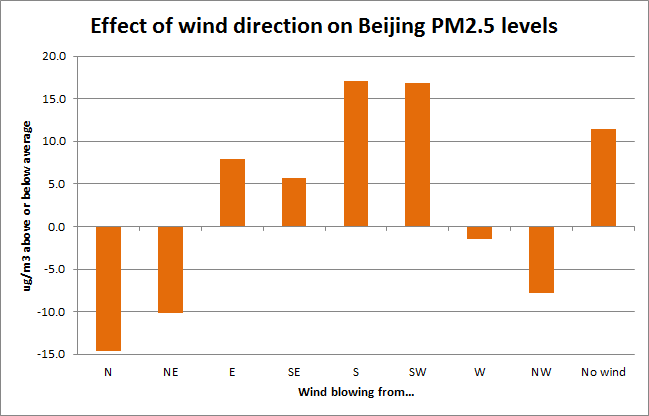
Second, day-to-day and seasonal air quality is influenced by wind direction, humidity, temperature, and other factors. For example, Greenpeace analysis suggests that Beijing experiences significantly lower PM2.5 levels when the wind blows from the north (see below image). As such, even if Beijing is currently experiencing lower pollution levels, how much of that is due to short-term favorable wind and weather patterns, rather than the government’s actions on air pollution, remains an open question.
Nonetheless, there are some ways to account for these problems and to look more closely for signs of a trend.
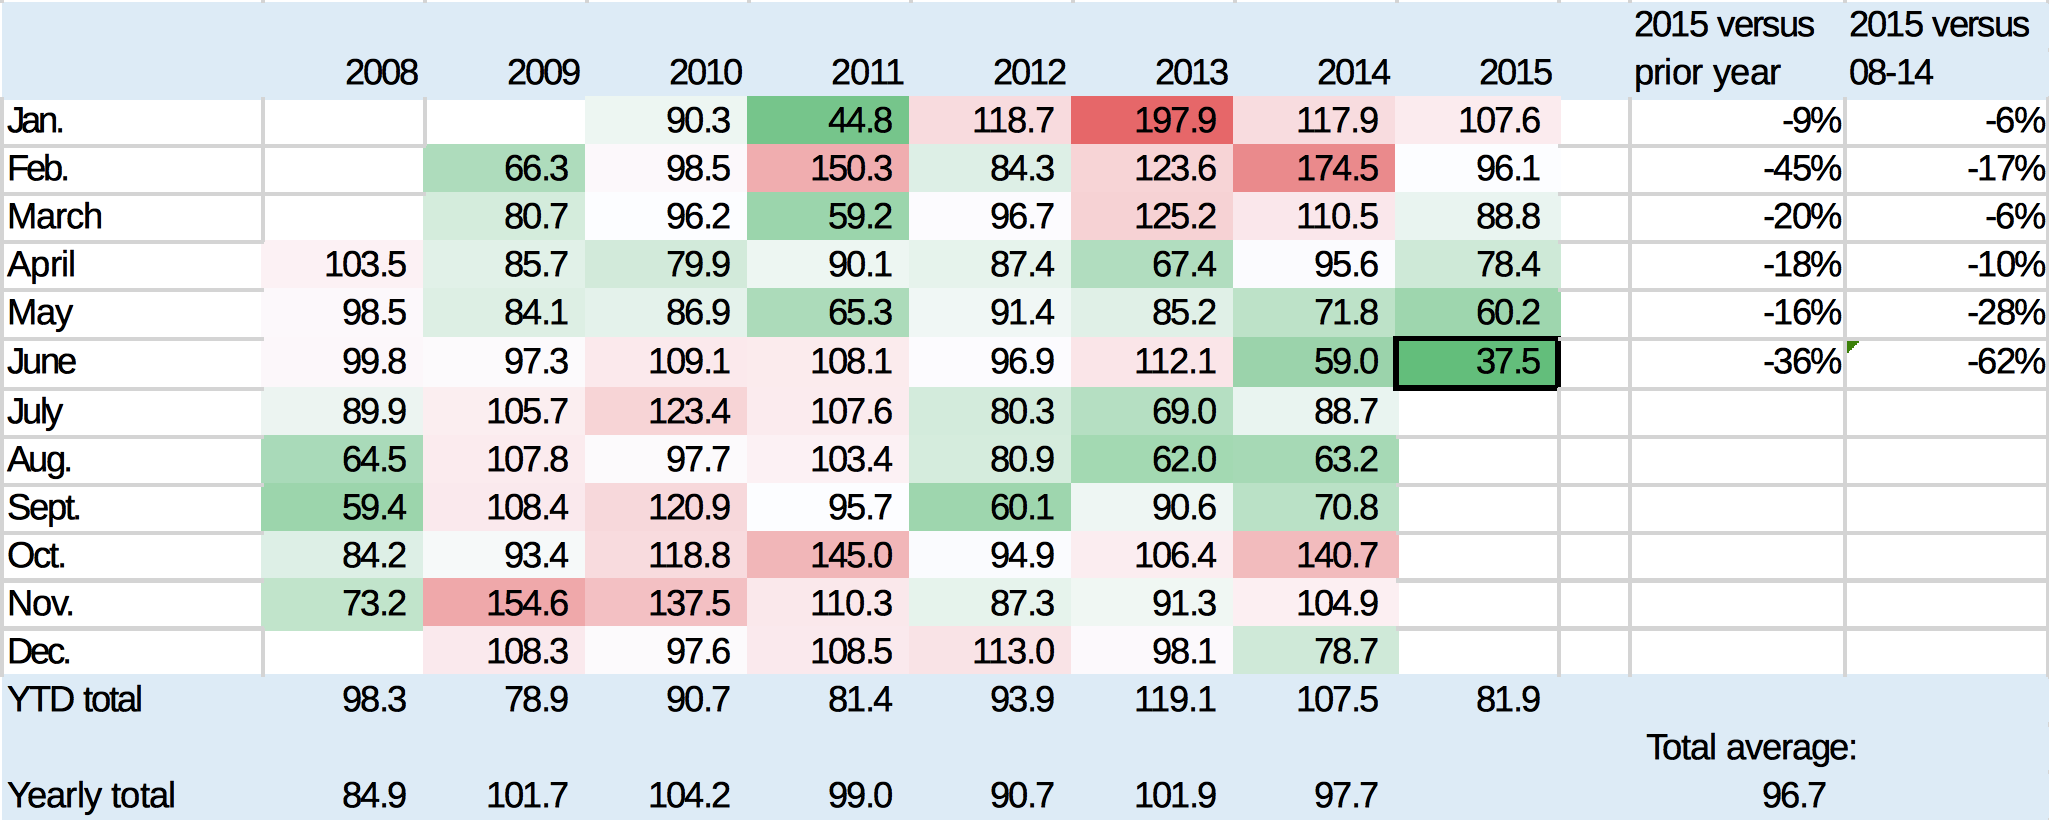
To get around the lack of historical data, we looked at the US embassy data, which reaches back to 2008, and thus allows better long-term comparisons (even though the US embassy only provides one measurement point of PM2.5, versus hundreds of monitoring points nationally by the Chinese government since 2013). Here we can see that 2015 so far is shaping up to be much better compared to 2014. In every month in 2015, PM2.5 readings have been lower year-on-year. Even more significantly, the average monthly PM2.5 level through June 15, 2015 (82 µg/m3), is far lower than the full-year average for all of the years going back to 2008 (97 µg/m3), and in-line with the best two prior years on a year-to-date basis.
Beijing PM2.5 concentrations, U.S. Embassy data, as of June 15, 2015
Then, to get around the factors of favorable wind and weather patterns, we built a regression model for Beijing’s hourly PM2.5 levels.
Regression Forecast for Beijing PM2.5 Adjusting for Weather Factors
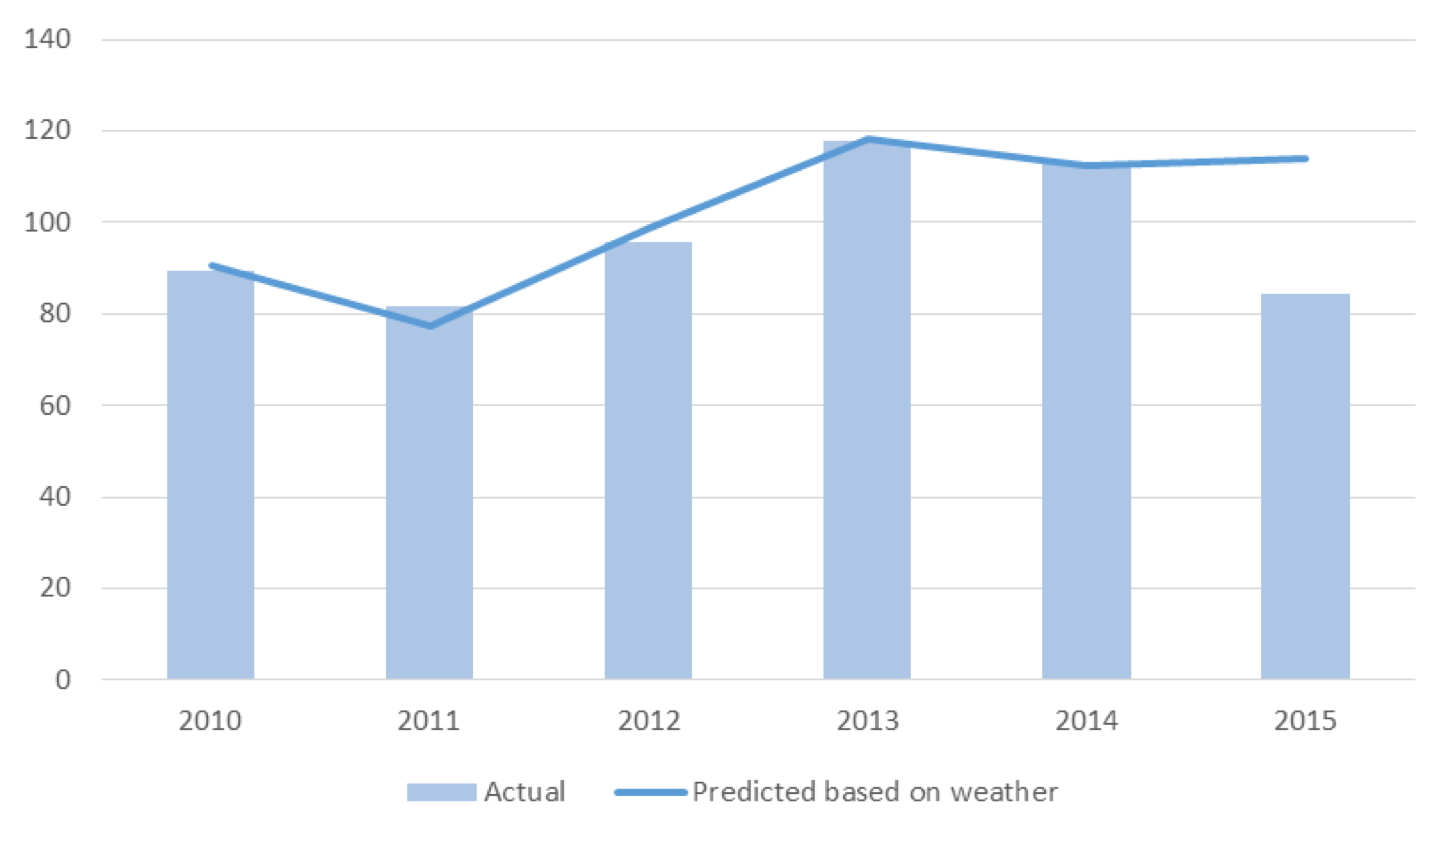
In the above charts, we can see how Beijing’s actual PM2.5 levels for 2015 have been substantially lower compared to an air quality forecast adjusted for weather factors.
In other words, the weather has not been as significant a factor for 2015’s improved air quality compared with previous years. Furthermore, this year’s weather to date has not been especially windy compared to prior years; there has not been high incidence of winds from favorable directions, nor has the air been drier, which was the case in the same period in the “lucky” years of 2009 and 2011. So if it appears that 2015 has been a good year for Beijing so far, what about the rest of the country? And if weather does not explain the cleaner air, what does?
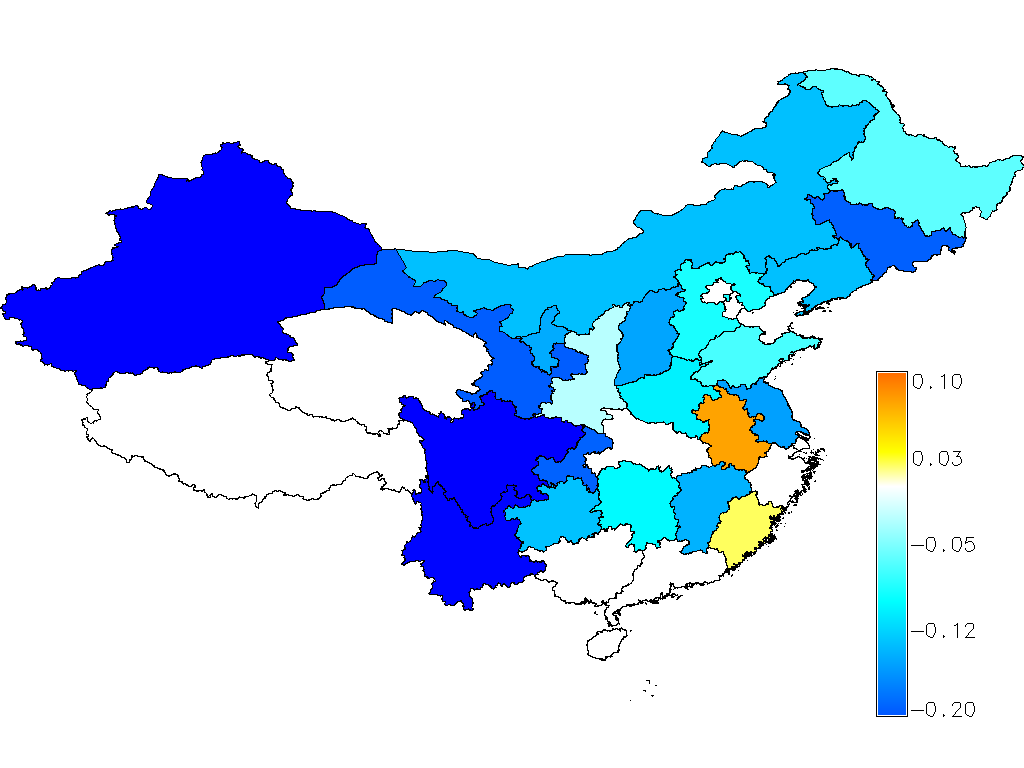
To answer the first question, we looked at the Chinese government’s data for 2015 to date, and compared it with 2014 for the same time period. Generally speaking, it appears that there has been a broad improvement across the country. However the improvement is uneven (see below).
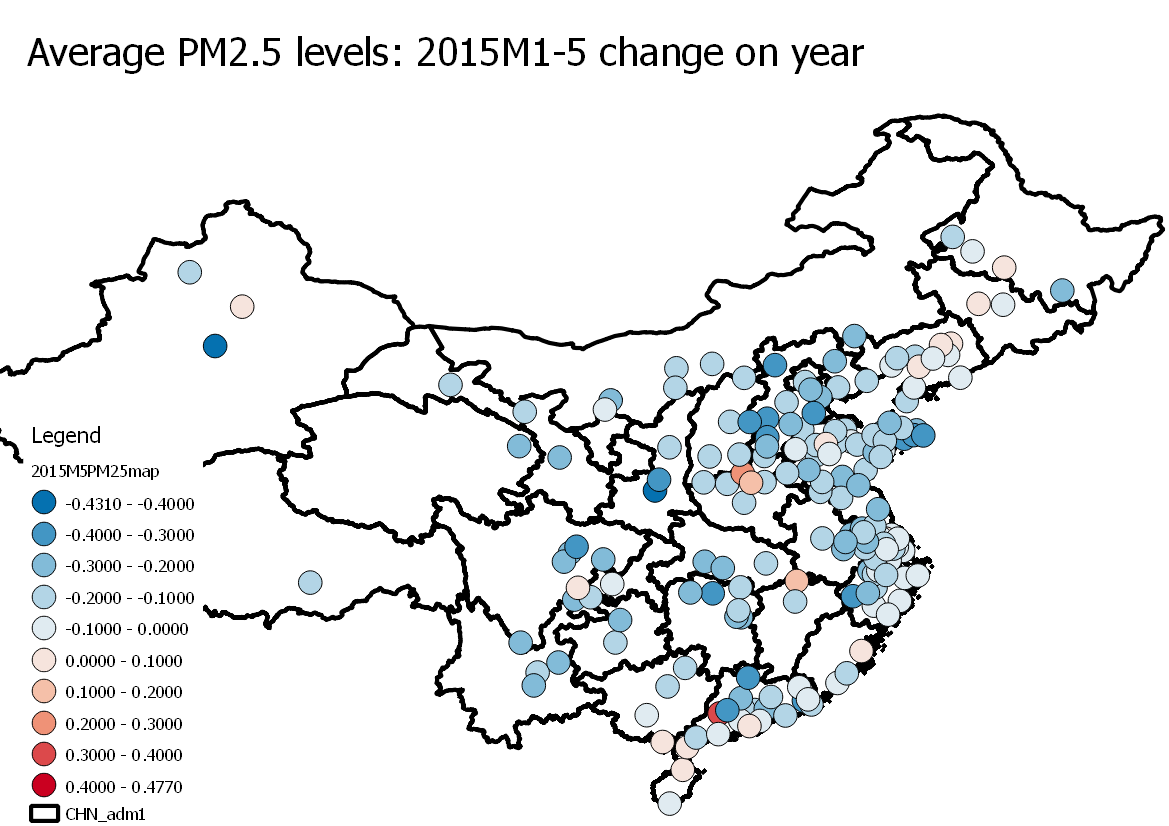
In the above image, note how PM2.5 reductions are especially pronounced in the most polluted region of the North China Plain, stretching from the northern part of Jiangsu through Shandong and Hebei province near Beijing. In comparison, the Yangtze River Delta region has seen more modest improvement, and in a few specific locales, there has been an outright increase in PM 2.5 levels. Nonetheless, the improvement generally appears widespread.
Answering the second question about what is really is behind China’s blue skies is more difficult.
However, there is some evidence that these reductions could be due to changes in industrial production and coal consumption.
As detailed in a new report by the Paulson Institute, Climate Change, Air Quality and the Economy, coal consumption is responsible for a large share of PM2.5 emissions, with heavy industry and the power sector being the largest consumers of coal. As such, lower coal consumption and heavy industrial production should be linked to lower PM2.5 levels. Indeed, that is what data analyzed by Greenpeace suggests. In the first four months of 2015, coal consumption has declined substantially, by approximately 8% year-on-year, led by a precipitous fall in power sector coal use. In the below image, note how coal sales in the first four months of 2015 by key mining companies in China have generally been flat or lower compared to the same period in 2014.
Key mining companies’ coal sales: Year-on-year change for Jan – April
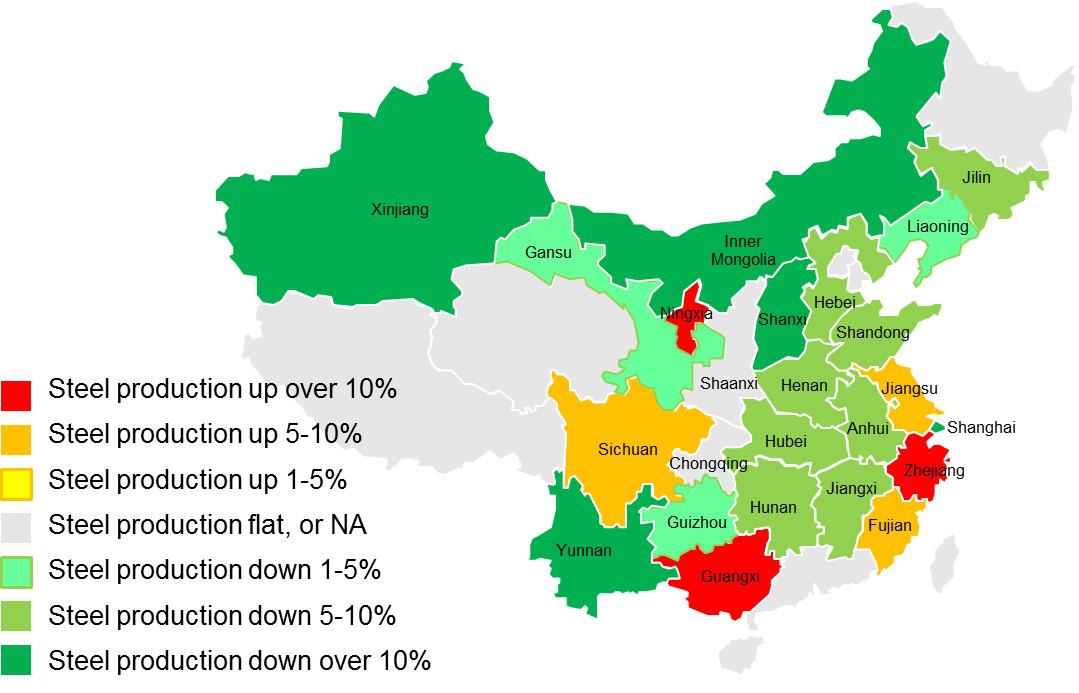
At the same time, individual heavy industry sectors have seen reduced production in most provinces. Steel production, often cited as a main culprit for air pollution, has been generally flat or in decline in first 4 months of 2015, compared to the same period in 2014 (See below).
Steel Production: Year-on-year change for Jan – April
Taking in all of these observations, that there is both a general improvement in air pollution, and reduced coal consumption and industrial emission growth, suggests empirically that there may be a link.
However, digging deeper, what is causing this reduced coal consumption and industrial emissions growth? Is it due to the successful implementation of China’s air pollution action plans? Or is it due more to structural changes in China’s economy, which may also have caused adjustment in the nation’s heavy industry sectors? On this hypothesis, it is notable that residential and tertiary electricity consumption grew in the first part of the year, while heavy industry electricity consumption stayed flat or declined.
Overall though, the answer is yet unclear, and it could be a combination of both. But even if we cannot affirmatively conclude which aspect more explains the cleaner air, suffice to say that should these two trends continue – effective implementation of China’s air pollution plan, and structural changes to China’s economy – we may yet see even more blue skies in Beijing
Two final points to end:
First, despite the dour state of the coal and heavy industry in China, it would be misplaced to imply that China must simply slow its economy to address air pollution. A recent analysis by Bloomberg’s Chief Asia Economist Tom Orlik suggests that China can reduce its PM2.5 levels by 9% from 2014 levels by 2020 and still maintain 6.5% GDP growth. The key to this is implementing the right package of reforms.
These are Bloomberg’s suggestions:
- Rebalance the economy away from the industrial to the services sector (8% emissions drop versus business-as-usual, or BAU)
- Increase energy efficiency (16% emissions drop versus BAU)
- Reduce coal use (6% emissions drop versus BAU)
- Continue control of end of pipe emissions (17% emissions drop versus BAU)
In other words, with smart reform policies, there is no tradeoff between economic and environmental prosperity. In fact, Bloomberg analysts also highlight that attempting to bring air pollution under control by simply lowering output, rather than pursuing the abovementioned reforms, would require a 1.5% annual contraction in GDP every year to 2020 to achieve the same 9% reduction in emissions.
Second, despite the progress we have presented, China still has a long way to go. Year to-date average levels of PM2.5 of 82 µg/m3 are far above the World Health Organization’s guideline for annual PM2.5 of 10 µg/m3 and more than double its “interim target” of 35 µg/m3. Air pollution is still a health hazard; a 2014 study by Peking University showed that ambient PM2.5 exposure is linked to excess mortality of 670,000 people per year in China.
As such, China must continue its vigilance on this issue, which will in some cases require difficult choices to be made. However, policymakers can perhaps take comfort that there is much more to be gained for their efforts. According to ta study by Peking University, the fall in mortalities by reducing air pollution is actually non-linear; every constant decrease in PM 2.5 level actually decreases the associated air pollution mortalities by an increasing proportion. If China were to reduce its PM 2.5 level by 50µg to 35µg/m3, mortalities would fall 23% (154,100 lives saved). But if it were to continue extend that ambition and cut PM 2.5 levels by a further 10µg, to 15 µg/m3, mortalities would fall 75% (502,500 lives saved).
In sum, even as Beijingers take time to savor a clearer 2015, China’s policymakers should avoid complacency and continue their efforts to address air pollution and to reform the economy. If they do this, blue-sky days in Beijing (with PM 2.5 levels lower than 10µg/m3) may soon be a permanent fixture, rather than the exception.