


By Anders Hove
For the last few weeks people in Beijing have been talking about how uncharacteristically clear the air has been. Several news outlets have reported that Beijing’s pollution levels have shown improvement since Jan 1, the day China’s new environmental law came into force.
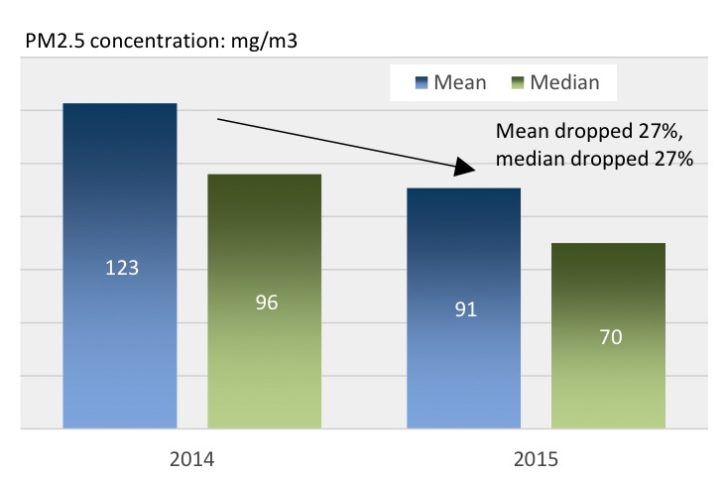
But does the clean air represent a real turning point, resulting from policy actions and the new law? It’s still too soon to say. For starters, local ambient air quality depends strongly on weather conditions like wind, humidity, and air inversions. It’s true that after considering various weather factors, air quality in the Beijing-Tianjin-Hebei region (also called Jing-Jin-Ji) in the last few months has indeed been better compared with 2014. In the first four months of 2015, the average concentration of PM2.5 has fallen more than 25% from the same period in 2014. Since a few weeks of heavy pollution can skew the averages, it’s important to consider the median value, and that has fallen as well: from 96 micrograms per cubic meter in the first four months of 2014 to just 70 micrograms so far this year. (While the improvement is notable, Beijing’s ambient air quality remains far worse than the national standard of 35 micrograms per cubic meter, let alone the World Health Organization’s annual standard of 10 micrograms per cubic meter.)
The drop in Beijing PM2.5 has people talking
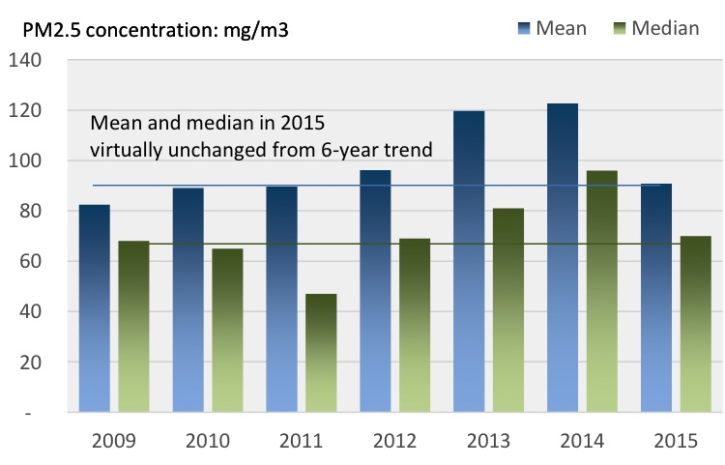
Does this suggest that Beijing policies — such as closing coal power plants, scrapping polluting “yellow label” vehicles, and shifting industrial production outside of the city — are starting to have an impact? Are the effects of the economic slowdown taking their toll on small, polluting factories in upwind areas of Hebei? Or are we simply seeing a reversion to the norm of recent years? Looking back to 2009 it’s hard to say. The extreme air pollution levels of, 2013 and 2014 appear to be anomalies. And so far, 2015 looks like a replay of levels in the first four months of 2009-2012. In other words, better, but still bad.
2015 PM2.5 levels actually in line with six-year trend
To truly understand the nature of such differences, however, you would need to consider weather patterns, such as humidity and wind speed and direction, which influence PM2.5 concentrations. Recent articles about the improved PM2.5 levels in 2015 have not mentioned weather factors. According to our preliminary research, 2014 wind and humidity conditions were particularly unfavorable for ambient PM2.5, while this year’s were a return to levels similar to 2009-2012. That might explain why this year’s PM2.5 levels appear to have reverted to the mean.
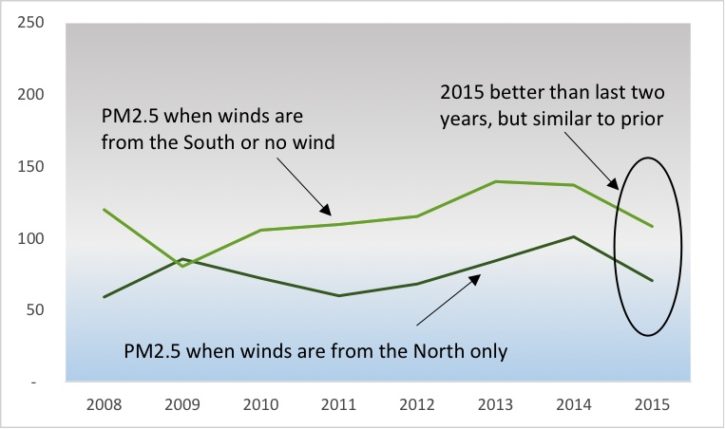
Wind speed and direction are also critical: Beijingers know that wind from the north brings fresher air. Based on analysis of wind direction and average PM2.5 concentrations in Beijing using U.S. embassy data, it appears that wind from the West, North, and Northeast are all significantly cleaner than those from the South or East. Grouping these directions together into categories shows that taking into account all wind conditions, ambient PM2.5 levels in Beijing were lower in 2015 versus 2013-2014, but not greatly different from levels in 2011-2012.
Beijing PM2.5 levels improved whether north wind or not—but only versus 2014
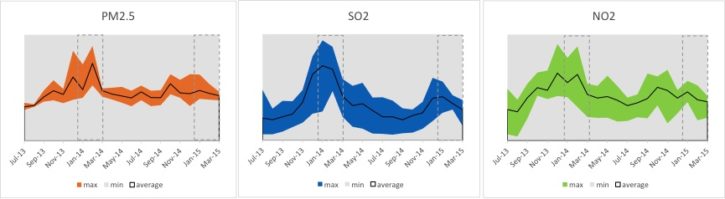
A large portion of Beijing’s PM2.5 originates from outside the borders of the municipality. Again, ambient pollution levels in several of Hebei’s most polluted cities in the first two or three months of 2015, have all gone down since the same period a year earlier. But levels don’t seem to have experienced a sharp drop in January 2015. Since the available data only go back to 2013, it’s impossible to call a trend.
Pollution in Hebei was especially bad in January-February last year
Bottom line: So far, Beijing has had significantly cleaner air in 2015 than the prior two years, and the comparison holds true even when accounting for wind and humidity. Lower emissions from neighboring cities may have played a role in improved air quality in Beijing. Government actions to shut down Beijing-area coal plants, enforce tighter environmental standards and retire polluting vehicles are important and laudable, but it is still too early to call a clear trend, since 2013-2014 were especially polluted years, especially the winter months. While we can’t yet say whether environmental policy moves such as shutting Beijing’s coal plants are at the root of the recent improvement, actions like these are crucial to putting the Jing-Jin-Ji region on the right path toward cleaner air and, ultimately, a more stable climate.
Anders Hove is Associate Director for China Research at the Paulson Institute.